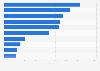
| Characteristic | Revenue in million U.S. dollars |
|---|---|
| 2019 | 497 |
| 2018* | 636 |
| 2017 | 1,204 |
| 2016 | 1,564 |
| 2015 | 1,708 |
| 2014 | 1,685 |
| 2013 | 1,881 |
| 2012 | 2,051 |
| 2011 | 1,981 |
| 2010 | 1,928 |
| 2009 | 1,892 |
| 2008 | 1,934 |
| 2007 | 1,764 |
| 2006 | 1,657 |
| 2005 | 1,645 |
| 2004 | 1,678 |
| 2003 | 1,879 |
The chart is not accessible to screen readers. Please switch to the table view to access the data.
Loading statistic...
Download
Source
Source
Release date
February 2020
More information
Region
Worldwide
Survey time period
2003 to 2019
Supplementary notes
This statistic was assembled from several of Pfizer's annual and financial reports.
* Viagra lost exclusivity in the U.S. in December 2017. In 2018, revenues for Viagra in the U.S. and Canada, which were reported in IH through 2017, were reported in EH (which reported all other Viagra revenues
excluding the U.S. and Canada through 2017). Therefore, in 2018, total Viagra worldwide revenues were reported in EH. Total Viagra revenues in 2017 and 2016 represented the aggregate of worldwide revenues
from Viagra IH and Viagra EH.
Citation formats