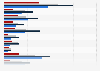
| Characteristic | Share of coffee drinkers |
|---|---|
| - | - |
| - | - |
| - | - |
| - | - |
The chart is not accessible to screen readers. Please switch to the table view to access the data.
Download
Source
More information
Region
United States
Survey time period
January 2020
Number of respondents
2,838 respondents
Age group
18 years and older
Special properties
both males and females, who consumed a beverage other than tap water the day prior to being interviewed
Method of interview
Online survey
Supplementary notes
Original survey question:' What did you drink yesterday during each of the following times? This may include any beverage that you drank at home or outside your home and may have come in a cup, can or bottle.'
Base: Total sample aged 18+ 鈥� 2020 (n=2,838); 18-24 (n=450), 25-39 (n=760), 40-59 (n=939),
60+ (n=689)
Citation formats