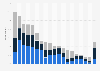
| Characteristic | A lot | Some | Not much | Not at all | Don't know/refused |
|---|---|---|---|---|---|
| - | - | - | - | - | - |
| - | - | - | - | - | - |
| - | - | - | - | - | - |
| - | - | - | - | - | - |
| - | - | - | - | - | - |
| - | - | - | - | - | - |
| - | - | - | - | - | - |
The chart is not accessible to screen readers. Please switch to the table view to access the data.
Download
Source
Source
Release date
September 2012
More information
Region
United States
Survey time period
May 9 to June 3, 2012
Number of respondents
n = 1,496
Age group
18 years and older
Method of interview
Telephone interview
Supplementary notes
The original question posed by the source was: "How much do you enjoy keeping up with the news 鈥� a lot, some, not much, or not at all?"
If y figure is missing from the graph, it was not provided by the source.
The date of survey and the number of respondents apply only to the 2012 data. Data regarding earlier years are available in the source, on page 45.
Citation formats