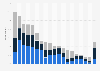
| Characteristic | November 2017 | April 2019 | April 2020 | May 2021 | Feb 2022 |
|---|---|---|---|---|---|
| ABC | 59% | 63% | 58% | 58% | 61% |
| CBS | 58% | 63% | 60% | 56% | 61% |
| NBC | 58% | 61% | 59% | 54% | 60% |
| The Wall Street Journal | 56% | 57% | 52% | 51% | 54% |
| CNN | 51% | 53% | 49% | 50% | 53% |
| The New York Times | 53% | 53% | 49% | 50% | 52% |
| Fox News | 52% | 52% | 46% | 44% | 48% |
| MSNBC | 49% | 48% | 44% | 43% | 48% |
| The Washington Post | - | 49% | 45% | 45% | 48% |
| National Public Radio | 46% | 49% | 43% | 43% | 44% |
| Huffington Post | 38% | 39% | 30% | 31% | 34% |
The chart is not accessible to screen readers. Please switch to the table view to access the data.
Loading statistic...
Download
Source
Sources
Release date
February 2022
More information
Region
United States
Survey time period
2017 to 2022
Number of respondents
2,210 respondents
Age group
18 years and older
Special properties
among those who rated the organization 'very' or 'somewhat' credible
Method of interview
Online survey
Supplementary notes
Question: How credible are each of the following?
Dates of survey were as follows: November 2 to 6, 2017; March 28 to April 2, 2019; April 16 to 18, 2020; May 6 to 9, 2021; February 9 to 10, 2022. Survey was not conducted in 2018.
The Washington Post was not included in the 2017 survey.
Citation formats