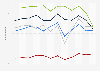
| Characteristic | Share of colorful cars |
|---|---|
| - | - |
| - | - |
| - | - |
| - | - |
| - | - |
| - | - |
| - | - |
| - | - |
| - | - |
| - | - |
| - | - |
| - | - |
| - | - |
| - | - |
| - | - |
| - | - |
| - | - |
| - | - |
| - | - |
| - | - |
| - | - |
| - | - |
| - | - |
| - | - |
| - | - |
| - | - |
| - | - |
| - | - |
| - | - |
| - | - |
| - | - |
| - | - |
| - | - |
| - | - |
| - | - |
| - | - |
| - | - |
| - | - |
| - | - |
| - | - |
| - | - |
| - | - |
| - | - |
| - | - |
| - | - |
| - | - |
| - | - |
| - | - |
| - | - |
| - | - |
The chart is not accessible to screen readers. Please switch to the table view to access the data.
Download
Source
More information
Region
North America, United States
Survey time period
January to August 2023
Special properties
colorful cars exclude black, gray, silver, and white cars.
Supplementary notes
The source analysed more than 10 million used cars aged between 1 an 5 years old and which were sold from January to August 2023. To find the most common car color nationwide, in each state, and in each metro region, data on the color of each car and the sale location were combined.
The source does not specify a publication date. The date of access to the data was set as the release date.
Citation formats