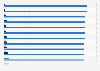
| Characteristic | Completely agree / mostly agree | Completely disagree / mostly disagree | Don't know / refused |
|---|---|---|---|
| Germany | 84% | 14% | 1% |
| India | 83% | 14% | 3% |
| Poland | 83% | 14% | 4% |
| France | 80% | 20% | 0% |
| Japan | 80% | 19% | 1% |
| China | 73% | 25% | 2% |
| South Korea | 70% | 28% | 2% |
| Britain | 70% | 27% | 4% |
| United States | 68% | 29% | 3% |
| Spain | 68% | 31% | 0% |
| Brazil | 66% | 33% | 0% |
| Russia | 63% | 29% | 7% |
| Nigeria | 62% | 35% | 2% |
| Pakistan | 60% | 29% | 12% |
| Kenya | 60% | 39% | 1% |
| Argentina | 58% | 40% | 3% |
| Turkey | 52% | 37% | 10% |
| Indonesia | 46% | 53% | 1% |
| Egypt | 44% | 54% | 2% |
| Mexico | 43% | 55% | 2% |
| Jordan | 39% | 49% | 12% |
| Lebanon | 29% | 70% | 1% |
The chart is not accessible to screen readers. Please switch to the table view to access the data.
July 2010
Worldwide
April 7 to May 8, 2010
18 years and older
Telephone interview
The source posed the question as follows: "Please tell me if you agree or disagree with the following statement. Men get more opportunities than women for jobs that pay well, even when women are as qualified as men for the job."
United States: N=1,002
Britain: N=750
France: N=752
Germany:N=750
Spain: N=755
Poland: N=750
Russia: N=1,001
Turkey: N=1,003
Egypt: N=1,000
Jordan: N=1,000
Lebanon: N=1,000
China: N=3,262
India: N=2,254
Indonesia: N=1,000
Japan: N=700
Pakistan: N=2,000
South Korea: N=706
Argentina: N=803
Brazil: N=1,000
Mexico: N=1,300
Kenya: N=1,002
Nigeria: N=1,000