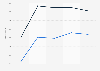
| Characteristic | Share of respondents |
|---|---|
| 2023 | 71% |
| 2022 | 71% |
| 2021 | 70% |
| 2020 | 67% |
| 2019 | 63% |
| 2018 | 67% |
| 2017 | 64% |
| 2016 | 61% |
| 2015 | 60% |
| 2014 | 55% |
| 2013 | 54% |
| 2012 | 50% |
| 2011 | 53% |
| 2010 | 44% |
| 2009 | 40% |
| 2008 | 40% |
| 2007 | 46% |
| 2006 | 42% |
| 2005 | 37% |
| 2004 | 42% |
| 1999 | 35% |
| 1996 | 27% |
The chart is not accessible to screen readers. Please switch to the table view to access the data.
Loading statistic...
Download
Source
Source
Release date
June 2023
More information
Region
United States
Survey time period
1996 to 2023
Age group
18 years and older
Method of interview
Telephone interview
Supplementary notes
According to the source: "Trend shown for polls in which same-sex marriage question followed questions on gay/lesbian rights and relations."
Missing percentage points to 100 percent are due to share of respondents stating "no opinion".
The original question posed at the source was: "Do you think marriages between same-sex couples should be recognized by law as valid, with the same rights as traditional marriages?"
1996 to 2006 wording: "Do you think marriages between homosexuals..."
Citation formats