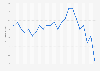
| Year | Index score (100-point scale) |
|---|---|
| - | - |
| - | - |
| - | - |
| - | - |
| - | - |
| - | - |
| - | - |
| - | - |
| - | - |
| - | - |
| - | - |
| - | - |
| - | - |
| - | - |
| - | - |
| - | - |
| - | - |
| - | - |
| - | - |
| - | - |
| - | - |
| - | - |
The chart is not accessible to screen readers. Please switch to the table view to access the data.
Download
Source
Source
In cooperation with
础颁厂滨庐
Release date
July 2023
More information
Region
United States
Survey time period
2002 to 2023
Number of respondents
2022-2023, n=7,979
Special properties
respondents chosen at random and contacted via email
Method of interview
Online interview
Supplementary notes
The source adds the following information: "the ACSI Search and Social Media Study 2022-2023 is based on interviews with 7,979 customers, chosen at random and contacted via email between July 2022 and June 2023. Customers are asked to evaluate their recent experiences with the largest search/information and social media websites in terms of visitor traffic, plus an aggregate category consisting of 鈥渁ll other鈥濃�� and thus smaller鈥攚ebsites in those categories."
Citation formats