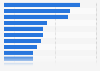
| Characteristic | Share of respondents |
|---|---|
| Search engine for general web search | 69.8% |
| Search engine for images or photos | 39.4% |
| Social media websites | 36.5% |
| Online travel agency websites | 28.6% |
| Airbnb.com | 24.7% |
| Online video (YouTube.com, etc) | 20.3% |
| Ask friends on social media | 17.1% |
| Official tourism office website | 16.2% |
| Travel-related podcasts | 12.6% |
| Map websites or mapping apps | 11.1% |
| Email travel newsletters | 9.9% |
| Digital assistant (Siri, Google Now, etc) | 9.3% |
| User review websites | 8.6% |
| Blogs, articles or stories | 7.2% |
The chart is not accessible to screen readers. Please switch to the table view to access the data.
Loading statistic...
Download
Source
Source
Release date
June 2019
More information
Region
United States
Survey time period
Spring 2019
Number of respondents
2,025 respondents
Age group
18 years and older
Special properties
traveled at least once and at least 50 miles away from home in the last 12 months for leisure or personal reasons
Method of interview
Online survey
Supplementary notes
Date of release was not given by source, release date is date accessed.
Citation formats