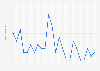
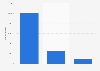
| Characteristic | Number of households |
|---|---|
| - | - |
| - | - |
| - | - |
The chart is not accessible to screen readers. Please switch to the table view to access the data.
Download
Source
More information
Region
Mexico
Survey time period
August 21 - November 28, 2018
Number of respondents
87,826 homes
Special properties
Includes only homes that have piped water inside or outside the dwelling
Supplementary notes
* Includes twice a week, once a week, and occasionally.
Citation formats