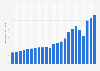
| Characteristic | Revenues in millions of U.S. dollars of the United States |
|---|---|
| Golden State Warriors | 800 |
| New York Knicks | 543 |
| Los Angeles Lakers | 522 |
| Boston Celtics | 457 |
| Dallas Mavericks | 437 |
| Houston Rockets | 416 |
| Chicago Bulls | 414 |
| Philadelphia 76ers | 396 |
| Cleveland Cavaliers | 391 |
| Brooklyn Nets | 381 |
| Miami Heat | 373 |
| Phoenix Suns | 369 |
| San Antonio Spurs | 363 |
| Washington Wizards | 362 |
| Denver Nuggets | 356 |
| Atlanta Hawks | 353 |
| Los Angeles Clippers | 353 |
| Toronto Raptors | 341 |
| Portland Trail Blazers | 335 |
| Milwaukee Bucks | 333 |
| Indiana Pacers | 320 |
| Oklahoma City Thunder | 320 |
| Sacramento Kings | 320 |
| Utah Jazz | 318 |
| Charlotte Hornets | 308 |
| Detroit Pistons | 305 |
| Minnesota Timberwolves | 305 |
| Memphis Grizzlies | 291 |
| Orlando Magic | 285 |
| New Orleans Pelicans | 272 |
The chart is not accessible to screen readers. Please switch to the table view to access the data.
Loading statistic...
Download
Source
Source
Release date
October 2024
More information
Region
North America
Survey time period
season 2023/2024
Supplementary notes
* Net stadium revenues used for debt payment.
Citation formats