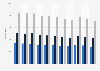
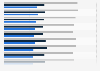
| Characteristic | Veteran | Non-veteran |
|---|---|---|
| Mental healthcare | 60% | 65% |
| Housing/housing stability | 47% | 47% |
| Physical healthcare | 45% | 44% |
| Stress management resources | 31% | 33% |
| Work/employment | 40% | 32% |
| Finances/Financial support | 30% | 31% |
| Social support | 20% | 25% |
| Food access/nutrition | 19% | 19% |
| Insurance | 14% | 17% |
| Caregiver support | 16% | 17% |
| Legal resources | 19% | 14% |
| Education | 19% | 15% |
| Transportation | 11% | 13% |
| Support for discrimination | 6% | 10% |
| Childcare | 7% | 8% |
| Internet access | 7% | 8% |
| None of these | 2% | 4% |
| Other | 2% | 1% |
| I don't know | 14% | 15% |
| Skipped | - | 1% |
The chart is not accessible to screen readers. Please switch to the table view to access the data.
Loading statistic...
Download
Source
Source
Release date
November 2024
More information
Region
United States
Survey time period
October 18 to 21, 2024
Number of respondents
1,028*
Age group
18 years and older
Special properties
A survey of the American general population with veteran oversample
Method of interview
Online panel
Supplementary notes
Q: "In which of the following areas, if any, do you think the Department of Veterans Affairs (VA) should be providing more assistance to Veterans? Please select all that apply."
* This poll is based on a nationally representative probability sample of 1,028 adults age 18 or older, including an oversample of 516 Veterans and total of 939 Non-veterans.聽
Citation formats