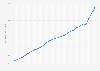
| Characteristic | Value added in million U.S. dollars |
|---|---|
| - | - |
| - | - |
| - | - |
| - | - |
| - | - |
| - | - |
| - | - |
| - | - |
| - | - |
| - | - |
| - | - |
| - | - |
| - | - |
| - | - |
| - | - |
| - | - |
| - | - |
| - | - |
| - | - |
| - | - |
| - | - |
| - | - |
| - | - |
| - | - |
| - | - |
The chart is not accessible to screen readers. Please switch to the table view to access the data.
May 2023
United States
1998-2022
The source adds the following: Gross output is principally a measure of sales or revenue from production for most industries, although it is measured as sales or revenue less cost of goods sold for margin industries like retail and wholesale trade. Intermediate inputs are the foreign and domestically-produced goods and services used up by an industry in the process of producing its gross output. Value added is the difference between gross output and intermediate inputs and represents the value of labor and capital used in producing gross output. The sum of value added across all industries is equal to gross domestic product for the economy. Value added is also measured as the sum of an industry鈥檚 compensation of employees, taxes on production and imports, less subsidies, and gross operating surplus.