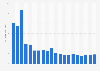
| Characteristic | Total cost | Out-of-pocket cost |
|---|---|---|
| 2013 | 241.77 | 61.13 |
| 2014 | 181.53 | 47.98 |
| 2015 | 117.08 | 35.52 |
| 2016 | 141.19 | 46.49 |
| 2017 | 133.6 | 63.73 |
| 2018 | 132.43 | 36.11 |
| 2019 | 280.52 | 26.44 |
| 2020 | 23.71 | 16.8 |
| 2021 | 32.8 | 16.62 |
| 2022 | 19.11 | 15.41 |
The chart is not accessible to screen readers. Please switch to the table view to access the data.
Loading statistic...
Download
Source
Sources
Release date
January 2025
More information
Region
United States
Survey time period
2013 to 2022
Supplementary notes
Release date represents the date figures were accessed.
Definitions:
"Total cost: The average total cost of the medication including the out-of-pocket cost (see below) plus the amount paid by other parties (Medicare, Medicaid, private insurance, Veterans Administration, TRICARE, other state/federal sources, Worker's compensation, and other miscellaneous sources)"
"Out-of-pocket cost: The average payment made by the patient which may include deductibles, coinsurance, copayments, or the cash price paid without insurance coverage."
Citation formats