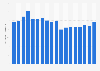
| Characteristic | Production in tons of live weight |
|---|---|
| - | - |
| - | - |
| - | - |
| - | - |
| - | - |
| - | - |
| - | - |
| - | - |
| - | - |
| - | - |
| - | - |
| - | - |
| - | - |
| - | - |
| - | - |
| - | - |
| - | - |
| - | - |
| - | - |
| - | - |
| - | - |
| - | - |
| - | - |
| - | - |
| - | - |
| - | - |
| - | - |
| - | - |
The chart is not accessible to screen readers. Please switch to the table view to access the data.
Download
Source
Source
Release date
June 2025
More information
Region
Germany
Survey time period
1997 to 2024
Supplementary notes
Total production of fish, molluscs, crustaceans and other aquatic organisms by aquaculture (fish farming). The data is presented in live weight equivalents of production, which is the weight of the product removed from the water. For mussels, the weight therefore includes the shell. Values from previous years are based on earlier data.
To access this statistic, click the web link and type the code "41362-0001" into the search bar.
Citation formats