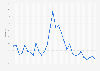
| Characteristic | Unemployment rate according to national definition (SECO)* | Unemployment rate according to international definition (ILO)** |
|---|---|---|
| 2014 | 3% | 4.8% |
| 2015 | 3.2% | 4.8% |
| 2016 | 3.3% | 4.9% |
| 2017 | 3.1% | 4.8% |
| 2018 | 2.5% | 4.7% |
| 2019 | 2.3% | 4.4% |
| 2020 | 3.1% | 4.8% |
| 2021 | 3% | 5.1% |
| 2022 | 2.2% | 4.3% |
| 2023 | 2% | 4% |
| 2024 | 2.4% | 4.3% |
The chart is not accessible to screen readers. Please switch to the table view to access the data.
February 2025
Switzerland
2014 to 2024
Annual averages
* The State Secretariat for Economic Affairs (SECO) calculated the unemployment rate based on unemployed people registered in the regional employment center in relation to the labor force according to the structural survey data on the working life of the population. Registered unemployed people are people who are registered with a regional employment center, do not have a job and can be placed immediately. It is irrelevant whether these people receive unemployment benefits or not.
** The Labor Force Survey of the Federal Statistical Office (BFS), which has been compiled since 1991, is based on the guidelines of the International Labor Office (IAA/ILO/BIT) and Eurostat and is used for international comparisons. In contrast to SECO, the BFS relies on quarterly sample surveys with telephone interviews and extrapolations.
*** In the linked document, only the values according to the national definition are shown. The figures according to the international definition can be obtained from the Federal Statistical Office.