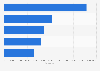
| Characteristic | Central Europe, Eastern Europe, and Central Asia | East, West, Central, and Southern Africa | High-income | Latin America and Caribbean | North Africa and Middle East | South Asia | Southeast Asia, East Asia, and Oceania | Global |
|---|---|---|---|---|---|---|---|---|
| - | - | - | - | - | - | - | - | - |
| - | - | - | - | - | - | - | - | - |
| - | - | - | - | - | - | - | - | - |
| - | - | - | - | - | - | - | - | - |
| - | - | - | - | - | - | - | - | - |
| - | - | - | - | - | - | - | - | - |
| - | - | - | - | - | - | - | - | - |
| - | - | - | - | - | - | - | - | - |
| - | - | - | - | - | - | - | - | - |
| - | - | - | - | - | - | - | - | - |
| - | - | - | - | - | - | - | - | - |
| - | - | - | - | - | - | - | - | - |
| - | - | - | - | - | - | - | - | - |
| - | - | - | - | - | - | - | - | - |
| - | - | - | - | - | - | - | - | - |
| - | - | - | - | - | - | - | - | - |
| - | - | - | - | - | - | - | - | - |
| - | - | - | - | - | - | - | - | - |
| - | - | - | - | - | - | - | - | - |
| - | - | - | - | - | - | - | - | - |
| - | - | - | - | - | - | - | - | - |
| - | - | - | - | - | - | - | - | - |
| - | - | - | - | - | - | - | - | - |
| - | - | - | - | - | - | - | - | - |
| - | - | - | - | - | - | - | - | - |
| - | - | - | - | - | - | - | - | - |
| - | - | - | - | - | - | - | - | - |
| - | - | - | - | - | - | - | - | - |
| - | - | - | - | - | - | - | - | - |
| - | - | - | - | - | - | - | - | - |
| - | - | - | - | - | - | - | - | - |
| - | - | - | - | - | - | - | - | - |
The chart is not accessible to screen readers. Please switch to the table view to access the data.
Download
Source
More information
Region
Worldwide
Survey time period
1990 to 2021
Special properties
GBD Super Regions (countries grouped by similar cause-of-death patterns).
Supplementary notes
Age-standardized rates The total number of deaths or DALYs per 100,000 people, calculated based on a standard population distribution across age categories. Age-standardized rates allow direct comparison of the disease burden among countries with different population sizes and age distribution (e.g., older or younger). Higher air pollution鈥揳ttributable, age-standardized disease rates reflect a combination of higher air pollution levels and sicker populations.
Citation formats