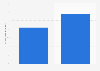
| Characteristic | Caregivers | Non-Caregivers |
|---|---|---|
| - | - | - |
| - | - | - |
The chart is not accessible to screen readers. Please switch to the table view to access the data.
December 2023
North America, United States
2023
1,505 respondents
21-64 years
1,505 full- and part-time U.S. workers, of which 753 were caregivers*
*The source adds the following information:
鈥淭he Workplace Wellness Survey (WWS) defines caregivers using the same criteria as the National Alliance for Caregiving/AARP Caregiving in the U.S. study. These individuals are defined as workers who provided unpaid care for an adult and/or a child with special needs within the past year and helped with at least one activity of daily living or instrumental activity of daily living.鈥�
Percentages do not add to 100 due to a small percentage (<1%) of workers identifying as transgender in both groups.