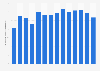
| Characteristic | *Approved active substances | **Active substances candidates for substitution | ***Non-approved active substances | ****Low-risk active substances |
|---|---|---|---|---|
| 2020 | 293.18 | 47.83 | 13.37 | 0.26 |
| 2019 | 260.1 | 53.88 | 16.94 | 0.16 |
| 2018 | 288.65 | 61.13 | 15.06 | 0.15 |
| 2017 | 282.66 | 59.88 | 15.04 | 0.18 |
| 2016 | 284.68 | 62.72 | 21.88 | 0.2 |
| 2015 | 275.87 | 60.81 | 27.72 | 0.16 |
| 2014 | 281.26 | 59.06 | 26.21 | 0.11 |
| 2013 | 263.17 | 57.21 | 26.66 | 0.08 |
| 2012 | 261.3 | 54.67 | 31.48 | 0.07 |
| 2011 | 268.22 | 56.36 | 40.1 | 0.05 |
The chart is not accessible to screen readers. Please switch to the table view to access the data.
Loading statistic...
Download
Source
Source
Release date
May 2023
More information
Region
EU
Survey time period
2011 to 2020
Supplementary notes
*Approved active substances that are neither low-risk nor candidates for substitution: This group includes active substances that have been approved for use in the EU but are not considered low-risk or candidates for substitution.
**Active substances that are candidates for substitution: These are active substances that are being considered for replacement by safer alternatives due to their potential risks to human health and the environment.
***Non-approved active substances: These are active substances that have not been approved for use in the EU.
****Low-risk active substances: These are active substances that are considered to have a low risk to human health and the environment.
Citation formats