| Characteristic | Share of respondents |
|---|---|
| - | - |
| - | - |
| - | - |
| - | - |
| - | - |
The chart is not accessible to screen readers. Please switch to the table view to access the data.
November 2022
Germany
August 17 to August 25, 2022
15,792*
18 years and older
Online survey
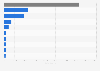
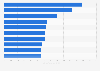
Data shows share of respondents who selected the options in response to the question: 'For the following question, by 鈥渃ycling infrastructure鈥�, we mean transportation systems and services that are designed to be safe and usable for bicycles. To what extent do you agree or disagree with the following statement? 鈥淭he cycling infrastructure has improved in my local area in the last 12 months鈥�.'
Results are weighted.
* Respondent count is for the overall survey, which was conducted in the United Kingdom, Spain, France, Germany, Netherlands, Italy, Austria, Sweden, Norway, Denmark, Poland, and Switzerland. The exact respondent count for Germany was not provided by the source.