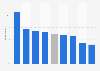
| Characteristic | Less than monthly | Monthly | Weekly |
|---|---|---|---|
| Throw away less food | 75% | 82% | 87% |
| Recycle more of what I previously would have thrown away | 73% | 81% | 86% |
| Use less energy at home | 72% | 82% | 84% |
| Repair rather than replace an item | 73% | 80% | 82% |
| Choose eco-friendly products | 70% | 78% | 80% |
| Walk, cycle, or take public transport instead of using a motor vehicle | 66% | 71% | 74% |
| Fly less often or not fly | 61% | 64% | 64% |
| Switch my home's energy to a renewable or cleaner source(s) | 61% | 66% | 64% |
| Eat less or no meat | 58% | 58% | 57% |
| Switch to an electric vehicle | 57% | 57% | 50% |
The chart is not accessible to screen readers. Please switch to the table view to access the data.
Loading statistic...
Download
Source
Sources
Release date
December 2022
More information
Region
Worldwide
Survey time period
August 26 to September 21, 2022
Number of respondents
see notes
Age group
18-75 years
Special properties
among those who are likely to or already do each of the actions listed
Method of interview
Online survey
Supplementary notes
Markets included in the survey: Brazil, France, Germany, India, Japan, Pakistan, United Kingdom, United States. Approximately 1,000 respondents per market.
Sample size based on frequency of climate news consumption as follows: Less than
monthly = 2,247, monthly = 1,301, weekly = 4,339
Citation formats