| Characteristic | Labor productivity percentage |
|---|---|
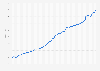
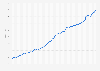
| 2023 | 84.2% |
| 2022 | 79.9% |
| 2021 | 76.8% |
| 2020 | 76.4% |
| 2019 | 73% |
| 2018 | 69.2% |
| 2017 | 65.6% |
| 2016 | 62.1% |
| 2015 | 58.7% |
| 2014 | 56.9% |
| 2013 | 56% |
| 2012 | 58.2% |
The chart is not accessible to screen readers. Please switch to the table view to access the data.
Loading statistic...
Download
Source
Source
Release date
October 2024
More information
Region
Romania
Survey time period
2012 to 2023
Supplementary notes
GDP per person employed is intended to give an overall impression of the productivity of national economies expressed in relation to the European Union average. If the index of a country is higher than 100, this country's level of GDP per person employed is higher than the EU average and vice versa. Basic figures are expressed in PPS, i.e. a common currency that eliminates the differences in price levels between countries allowing meaningful volume comparisons of GDP between countries. Please note that "persons employed" does not distinguish between full-time and part-time employment.
Citation formats