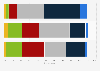
| Characteristic | Trust | Neither | Don't trust |
|---|---|---|---|
| - | - | - | - |
| - | - | - | - |
| - | - | - | - |
| - | - | - | - |
| - | - | - | - |
| - | - | - | - |
| - | - | - | - |
| - | - | - | - |
| - | - | - | - |
| - | - | - | - |
| - | - | - | - |
| - | - | - | - |
| - | - | - | - |
| - | - | - | - |
| - | - | - | - |
The chart is not accessible to screen readers. Please switch to the table view to access the data.
Download
Source
Sources
Release date
June 2026
More information
Region
Australia
Survey time period
January 9 to February 6, 2026
Number of respondents
2,000 respondents
Age group
18 years and older
Method of interview
Online survey
Supplementary notes
Those that haven鈥檛 heard of each brand were excluded. Only the mentioned brands were included in the survey so should not be treated as a list of the most trusted brands
Trust = percent scored 6鈥�10 on 10-point scale, Don鈥檛 trust = 0鈥�4, Neither = 5.
Figures have been rounded.
Citation formats