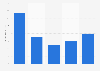
| Characteristic | Share of retailers |
|---|---|
| - | - |
| - | - |
| - | - |
| - | - |
The chart is not accessible to screen readers. Please switch to the table view to access the data.
Download
Source
Sources
In cooperation with
PYMNTS
Release date
October 2022
More information
Region
United Kingdom, United States
Survey time period
June 1 to June 21, 2022
Number of respondents
300*
Supplementary notes
* Survey sample includes 151 retailers in the United States and 149 retailers in the United Kingdom with at least 50 store locations representing the general retail, grocery retail, pharmacy and convenience retail and new or used automobile sales segments. The merchants in the U.S. had at least 1 billion U.S. dollars in annual revenues and those in the UK had at least 100 million British pounds (127 million U.S. dollars)
Citation formats