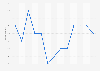
| Characteristic | Trump favorability all Americans | DeSantis favorability all Americans | Trump favorability Republican voters | DeSantis favorability Republican voters |
|---|---|---|---|---|
| November 11 - 14, 2023 | 42% | 40% | 82% | 76% |
| October 28 - 31, 2023 | 41% | 35% | 83% | 69% |
| September 17 - 19, 2023 | 41% | 36% | 84% | 72% |
| August 12 - 15, 2023 | 41% | 34% | 81% | 63% |
| July 15 - 18, 2023 | 41% | 37% | 82% | 72% |
| June 24 - 27, 2023 | 43% | 38% | 79% | 71% |
| May 27 - May 31, 2023 | 40% | 38% | 78% | 68% |
| Apr 29 - May 2, 2023 | 46% | 43% | 85% | 77% |
| Apr 8 - 11, 2023 | 45% | 41% | 84% | 72% |
| Mar 26 - 28, 2023 | 43% | 44% | 75% | 72% |
| Feb 11 - 14, 2023 | 40% | 41% | 73% | 71% |
| Jan 29 - 31, 2023 | 40% | 38% | 79% | 66% |
| Jan 14 - 17, 2023 | 45% | 46% | 80% | 77% |
| Nov 26 - 29, 2022 | 42% | 38% | 79% | 71% |
| Nov 19 - 22, 2022 | 39% | 42% | 73% | 70% |
| Nov 13 - 15, 2022 | 41% | 41% | 77% | 74% |
| Oct 16 - 18, 2022 | 42% | 38% | 81% | 73% |
| Oct 8 - 11, 2022 | 40% | 40% | 76% | 68% |
| Oct 1 - 4, 2022 | 40% | 40% | 82% | 74% |
| Sep 24 - 27, 2022 | 41% | 39% | 81% | 70% |
| Sep17 - 20, 2022 | 43% | 41% | 83% | 68% |
| Aug 20 - 23, 2022 | 39% | 37% | 78% | 70% |
| Jul 2 - 5, 2022 | 36% | 34% | 79% | 67% |
| Apr 30 - May 3, 2022 | 40% | 37% | 81% | 69% |
The chart is not accessible to screen readers. Please switch to the table view to access the data.
Loading statistic...
Download
Source
Sources
In cooperation with
YouGov
Release date
November 2023
More information
Region
United States
Survey time period
April 30, 2022 to November 14, 2023
Number of respondents
At least 1,400 per survey
Age group
18 years and older
Special properties
U.S. adults
Method of interview
Online interview
Supplementary notes
Includes both 'very favorable' and 'somewhat favorable' answers.
Citation formats