

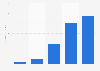
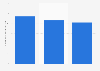

| Characteristic | MAU in millions |
|---|---|
| - | - |
| - | - |
| - | - |
| - | - |
| - | - |
| - | - |
| - | - |
| - | - |
| - | - |
| - | - |
| - | - |
| - | - |
| - | - |
| - | - |
| - | - |
| - | - |
| - | - |
| - | - |
| - | - |
| - | - |
| - | - |
| - | - |
The chart is not accessible to screen readers. Please switch to the table view to access the data.
Download
Source
Source
Release date
March 2026
More information
Region
Worldwide
Survey time period
Q3 2020 to Q4 2025
Supplementary notes
*From Q3 2023 onwards, Rumble changed its metric for calculating MAUs which cannot be meaningfully compared to the previous quarters. It now represents the total web, mobile app, and connected TV users. Previous MAU reportings did not include connected TV users.
Citation formats

