


| Characteristic | Less than 5 hours | 5-9 hours | 10-19 hours | 20-29 hours | 30-39 hours | More than 40 hours |
|---|---|---|---|---|---|---|
| - | - | - | - | - | - | - |
| - | - | - | - | - | - | - |
| - | - | - | - | - | - | - |
| - | - | - | - | - | - | - |
The chart is not accessible to screen readers. Please switch to the table view to access the data.
Download
Source
Sources
In cooperation with
Ornico
Release date
June 2022
More information
Region
South Africa
Survey time period
January 18 to May 14 and July 13 to Semptember 31, 2021
Number of respondents
24,666 respondents
Age group
15 years and older
Special properties
The data was collected in two waves
Supplementary notes
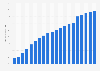
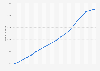
Data on hours spent on the internet in the past 7 days.
TGI/AskAfrika, annually interviews 24,666 respondents aged 15+ living in urban areas with 8,000 or more inhabitants, using a stratified random probability sample. The data is weighted to the South African national statistics service, "Statistics South Africa's" population estimates, which allow for an accurate representation of 27.76 million South Africans.
To ensure a nationally representative sample, the survey is based on enumerated area (EA) sampling.
Missing percentage points to 100 percent are probably due to rounding.
Citation formats



