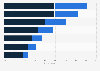


| Characteristic | Share of respondents |
|---|---|
| I expect it to be on the devices | 17% |
| I do not know which one to choose | 17% |
| Too difficult to install and maintain | 15% |
| Too complex to understand | 15% |
| I would not know where to look for a solution | 12% |
| Too costly | 11% |
| None | 9.7% |
The chart is not accessible to screen readers. Please switch to the table view to access the data.
Loading statistic...
Download
Source
Source
Release date
December 2021
More information
Region
Worldwide, Europe, United States
Survey time period
October 14, 2021 to November 15, 2021
Number of respondents
1,146 respondents
Age group
18 years and older
Method of interview
Online survey
Supplementary notes
According to the source: "The survey was shared through mailing lists, newsletters, social media channels,Reddit communities and one-on-one reach."
"This online survey is based on non-random sampling and therefore we cannot draw conclusions for the entire population nor make predictions."
The survey participants were divided as following: 54 percent from Europe, 28 percent from North America, six percent from Asia, 3.2 percent from Oceania, 2.7 percent from South America, while 4.8 percent of respondents decided not to disclose their location.
Citation formats