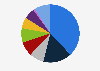
| Characteristic | Definitely / rather yes | Definitely / rather not | Difficult to answer |
|---|---|---|---|
| Feb 2023 | 11% | 88% | 1% |
| Feb 2022 | 19% | 79% | 2% |
| May 2021 | 22% | 77% | 1% |
| May 2019 | 16% | 83% | 2% |
| May 2017 | 15% | 79% | 7% |
| May 2016 | 19% | 75% | 6% |
| May 2015 | 16% | 79% | 5% |
| May 2014 | 17% | 77% | 7% |
| May 2013 | 22% | 69% | 9% |
| May 2012 | 20% | 73% | 8% |
| May 2011 | 22% | 73% | 5% |
| Apr 2009 | 13% | 80% | 6% |
| Oct 1994 | 11% | 76% | 13% |
| Mar 1993 | 15% | 72% | 14% |
| Apr 1992 | 13% | 77% | 10% |
| Oct 1990 | 11% | 69% | 20% |
The chart is not accessible to screen readers. Please switch to the table view to access the data.
Loading statistic...
Download
Source
Source
Release date
March 2023
More information
Region
Russia
Survey time period
February 21 to 28, 2023
Number of respondents
1,626 respondents
Age group
18 years and older
Method of interview
Face-to-face interview
Supplementary notes
The survey was conducted throughout all of Russia in both urban and rural settings, in 137 localities and 50 regions.
The statistical sampling error (with a probability of 0.95) does not exceed: 3.4% 鈥� for indices close to 50%, 2.9% 鈥� for indices close to 25% / 75%, 2.0% 鈥� for indices close to 10% / 90%, 1.5% 鈥� for indices close to 5% / 95%.
"Difficult to answer" figures were calculated manually by deducting all other options from 100 percent.
Survey characteristics refer to the latest survey.
Citation formats