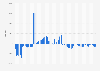
| Characteristic | Net migration |
|---|---|
| - | - |
| - | - |
| - | - |
| - | - |
| - | - |
| - | - |
| - | - |
| - | - |
| - | - |
| - | - |
| - | - |
| - | - |
| - | - |
| - | - |
| - | - |
| - | - |
| - | - |
| - | - |
| - | - |
| - | - |
| - | - |
| - | - |
| - | - |
| - | - |
| - | - |
The chart is not accessible to screen readers. Please switch to the table view to access the data.
May 2021
Latvia
1996 to 2020
The source specified the following information:
"As of the data on 2017, the number of persons having declared their place of residence at their workplace (enterprise registered in Latvia) and not living Latvia actually was excluded from the number of usually resident population, therefore population number in M膩rpue county shown under the indicator 鈥淧opulation Number at the Beginning of the Year鈥� has declined. The changes in methodology influenced also population in Riga and Carnikava county, however less.
Until 2019 data were published by the actual place of residence, but since 2020 - by the registered place of residence."