

| Characteristic | Desktop | Mobile |
|---|---|---|
| - | - | - |
| - | - | - |
| - | - | - |
| - | - | - |
| - | - | - |
| - | - | - |
| - | - | - |
| - | - | - |
| - | - | - |
| - | - | - |
| - | - | - |
| - | - | - |
| - | - | - |
| - | - | - |
| - | - | - |
The chart is not accessible to screen readers. Please switch to the table view to access the data.
Download
Source
Source
In cooperation with
Semrush
Release date
August 2021
More information
Region
Worldwide
Survey time period
January 2020 to March, 2021
Number of respondents
15,000 keywords
Special properties
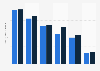
average time spent on Youtube.com per user per visist
Supplementary notes
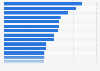
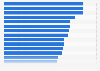
According to the source:"We pulled 15,000 keywords from our Google Keywords Database, which triggered a Featured Video result on the SERP. We took a look at YouTube鈥檚 top 10 search results for each of these keywords to check how different video features affect their positions in YouTube search. Based on this data, we gathered a wide range of metrics to assess which of them affect videos鈥� performance. [...] We used median values instead of average values to compare metrics for different positions since they are more resistant to outliers."
Citation formats