| Characteristic | Attendance rate growth |
|---|---|
| - | - |
| - | - |
| - | - |
| - | - |
| - | - |
| - | - |
The chart is not accessible to screen readers. Please switch to the table view to access the data.
Download
Source
Sources
Release date
March 2021
More information
Region
France
Survey time period
September 2020 to January 2021
Supplementary notes
Figures before February 2021 come from previous reports.
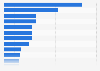
The traffic is calculated in relation to the same period of the previous year:
September 2020 compared to September 2019
October 2020 compared to October 2019
Weekend of store reopening 2020 compared with the last weekend of November 2019
Black Friday Week 2020 compared to Black Friday Week 2019
First days of the 2021 winter sale compared to the first 10 days of the 2020 winter sale
January 2021 compared to January 2020
Citation formats