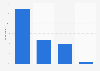
| Characteristic | Not ready to pay more | Ready to pay about 5% more | Ready to pay about 15% more | Ready to pay 30% more | Ready to pay half more than usual | Ready to pay twice more than usual | Difficult to answer |
|---|---|---|---|---|---|---|---|
| Fuel (petrol, gas, disel fuel) | 76% | 8% | 6% | 3% | 2% | 1% | 4% |
| Utilities and maintenance of houses, apartments | 74% | 9% | 8% | 4% | 2% | 1% | 2% |
| Electricity | 69% | 11% | 9% | 5% | 3% | 1% | 2% |
| Car | 66% | 9% | 8% | 3% | 2% | 1% | 11% |
| Public transport | 62% | 11% | 9% | 5% | 4% | 2% | 7% |
The chart is not accessible to screen readers. Please switch to the table view to access the data.
Loading statistic...
Download
Source
Source
Release date
September 2020
More information
Region
Russia
Survey time period
September 26, 2020
Number of respondents
1,600 respondents
Age group
18 years and older
Method of interview
Telephone interview
Supplementary notes
The original question was worded by the source as follows: "Are you ready to pay more for the following goods and services if you knew that your funds would be spent on the introduction of alternative energy sources or improving energy efficiency of facilities?"
Citation formats