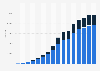



| Characteristic | Sales and billings in billions in U.S. dollars |
|---|---|
| - | - |
| - | - |
| - | - |
The chart is not accessible to screen readers. Please switch to the table view to access the data.
Download
Source
Sources
Release date
June 2020
More information
Region
Worldwide
Survey time period
2019
Supplementary notes
Estimated sales and billings from digital goods and services is not the same as total App Store billings. Analysis Group estimates the volume of sales from digital goods and services purchased elsewhere but used on apps on Apple devices, and, conversely, subtracts billings from in-app purchases made via the App Store but used elsewhere. The estimate is based on a combination of third-party sources and Apple data.
Citation formats



