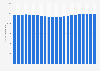
| Characteristic | I think so very much | I rather think so | In between | I do not really think so | I do not think so at all |
|---|---|---|---|---|---|
| - | - | - | - | - | - |
| - | - | - | - | - | - |
| - | - | - | - | - | - |
| - | - | - | - | - | - |
| - | - | - | - | - | - |
| - | - | - | - | - | - |
| - | - | - | - | - | - |
| - | - | - | - | - | - |
| - | - | - | - | - | - |
The chart is not accessible to screen readers. Please switch to the table view to access the data.
Download
Source
Source
Release date
December 2020
More information
Region
Japan
Survey time period
December 5 to 7, 2020
Number of respondents
3,948 respondents
Age group
15-69 years
Method of interview
Online survey
Supplementary notes
Sample sizes of previous surveys:
April 25 to 27 n=4,145
May 9 to 11 n=4,218
May 23 to 25 n=4,062
June 13 to 15 n=3,872
July 11 to 13 n=4,073
August 22 to 24 n=4,073
October 10 to 12 n=4,020
November 7 to 9 n=4,014
Figures may not add up to 100 percent due to rounding by the source.
Citation formats