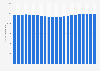
| Characteristic | Share of respondents |
|---|---|
| - | - |
| - | - |
| - | - |
| - | - |
| - | - |
| - | - |
| - | - |
| - | - |
| - | - |
| - | - |
| - | - |
| - | - |
| - | - |
| - | - |
| - | - |
| - | - |
| - | - |
| - | - |
| - | - |
| - | - |
The chart is not accessible to screen readers. Please switch to the table view to access the data.
Download
Source
Source
Release date
July 2021
More information
Region
Japan
Survey time period
June 26 to 28, 2021
Number of respondents
4,126*
Age group
15-69 years
Method of interview
Online survey
Supplementary notes
*Among respondents who watched a movie at a movie theater at least once within the past year. This group made up 24 percent of the survey sample.
Citation formats