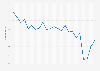
| Characteristic | Cinema visits per capita |
|---|---|
| - | - |
| - | - |
| - | - |
| - | - |
| - | - |
| - | - |
| - | - |
| - | - |
| - | - |
| - | - |
| - | - |
| - | - |
| - | - |
| - | - |
| - | - |
| - | - |
| - | - |
| - | - |
| - | - |
| - | - |
| - | - |
| - | - |
| - | - |
| - | - |
| - | - |
| - | - |
The chart is not accessible to screen readers. Please switch to the table view to access the data.
Download
Source
Sources
Release date
May 2025
More information
Region
Germany
Survey time period
1999-2024
Number of respondents
11,148 people from the Continuous Consumer Panel (2023)
Age group
10 years and older
Supplementary notes
According to the source, the number of visits per capita was calculated from the quotient of the number of cinema goers per year and the percentage share ("reach") of this number of the total population.
The figures for 1999 to 2010 were derived from previous publications.
Citation formats