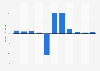
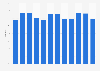
| Decline in occupancy | Share of respondents |
|---|---|
| - | - |
| - | - |
| - | - |
| - | - |
| - | - |
| - | - |
| - | - |
| - | - |
| - | - |
The chart is not accessible to screen readers. Please switch to the table view to access the data.
Download
Source
Sources
Release date
March 2020
More information
Region
Singapore
Survey time period
March 2020
Number of respondents
66 respondents
Special properties
among hoteliers in Singapore
Supplementary notes
Original question: Considering the influence of the COVID-19 outbreak, for your hotel, what is your expectation for percentage growth/decline for full-year 2020 (FY2020) vs full-year 2019 (FY2019)? [Occupancy]
Respondents accounted for a total of 23,924 rooms across 6 different classification of hotels. They accounted for 40% of Singapore's total gazetted supply.
Citation formats