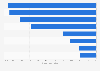
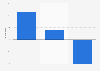
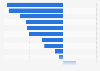
| Characteristic | Change in electricity demand |
|---|---|
| - | - |
| - | - |
| - | - |
| - | - |
| - | - |
| - | - |
| - | - |
The chart is not accessible to screen readers. Please switch to the table view to access the data.
Download
Source
Source
Release date
March 2020
More information
Region
Poland
Survey time period
March 16-22, 2020
Supplementary notes
* Weather-adjusted to be comparable to 16-22 Mar (using actual hourly temperature difference between 9-15 to 16-22 March). Assumes 0.8% fall in electricity demand for every 1 degree difference in temperature in capital city.
Citation formats