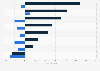
| Characteristic | Share of voice |
|---|---|
| - | - |
| - | - |
| - | - |
| - | - |
| - | - |
| - | - |
| - | - |
| - | - |
| - | - |
| - | - |
| - | - |
| - | - |
| - | - |
| - | - |
| - | - |
| - | - |
| - | - |
| - | - |
| - | - |
| - | - |
The chart is not accessible to screen readers. Please switch to the table view to access the data.
Download
Source
Source
In cooperation with
Pi Datametrics
Release date
October 2021
More information
Region
United States
Survey time period
Q3 2021
Special properties
across Google US; wider industry metrics may vary
Supplementary notes
Source defined "share of voice" through the following analyzed criteria: every returning site in Google US; for every search term; within every search theme; across every category.
Search terms included 12,011 of the most commercially valuable terms, and categories consisted of the following options: Computing, Home appliances, Small appliances, Smart tech & phones, Sound & vision
Citation formats