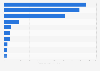
| Characteristic | 2019* | 2020 |
|---|---|---|
| - | - | - |
| - | - | - |
| - | - | - |
| - | - | - |
| - | - | - |
| - | - | - |
| - | - | - |
| - | - | - |
| - | - | - |
| - | - | - |
The chart is not accessible to screen readers. Please switch to the table view to access the data.
Download
Source
Source
Release date
November 2019
More information
Region
Norway
Survey time period
2019 to 2020
Number of respondents
more than 75
Special properties
influential Norwegian companies from 10 industries
Supplementary notes
The source provides the following information about the grading system:
0 Failed
1 Poor
2 Sufficient
3 Satisfactory
4 Very good
5 Outstanding
*Mobile was a separate category the previous years. Therefore, data was adjusted accordingly, so that comparison can be correct.
Citation formats