The chart is not accessible to screen readers. Please switch to the table view to access the data.
Advertisement
Advertisement
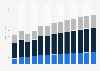
Revenue in the luxury goods market in Australia and Oceania from 2018 to 2030, by segment (in million U.S. dollars)
Revenue in the luxury goods market in Australia and Oceania 2018-2030, by segment
In the luxury goods market in Australia and Oceania in 2024, the luxury fashion segment generated the highest revenue, reaching approximately ** U.S. dollars. The luxury leather goods segment ranked second with around ** U.S. dollars, while luxury watches & jewelry followed with about * U.S. dollars.


Log in or register to access precise data.

Other statistics that may interest you Statistics on
About the industry
10
- Premium Statistic ARPU of luxury goods in Hong Kong 2018-2030, by segment
- Premium Statistic Revenue in the luxury goods market in Italy 2018-2030, by segment
- Premium Statistic Revenue of leading luxury brands Thailand 2023
- Premium Statistic Revenue growth of leading luxury brands Thailand 2023
- Premium Statistic Profit margin of leading luxury brands Thailand 2022
- Premium Statistic Profit of leading luxury brands Thailand 2023
- Basic Statistic Number of stores of Yves Saint Laurent worldwide 2025, by region
- Basic Statistic Revenue share of Yves Saint Laurent worldwide in 2025, by region
- Premium Statistic Reasons Millennials spend money on luxury products worldwide 2017
- Premium Statistic Luxury brand awareness in Taiwan 2024, by age group
About the region
2
Selected statistics
6
- Premium Statistic Revenue of luxury cosmetics in Hong Kong 2018-2030, by segment
- Basic Statistic Revenue share of Yves Saint Laurent worldwide in 2025, by product category
- Premium Statistic Luxury brand awareness in China 2024, by age group
- Basic Statistic Number of Kering Group stores worldwide 2025, by brand
- Premium Statistic Luxury brand awareness in Hong Kong 2024, by age group
- Premium Statistic Luxury brand awareness in China 2024
Other regions
10
- Premium Statistic Leading color cosmetic brands in China 2025, by market share
- Premium Statistic Organic cosmetics: consumption benefits according to the French 2016
- Premium Statistic Perception of organic and natural cosmetics labels in Europe 2016
- Premium Statistic Organic cosmetics: product types favored by French consumers 2016
- Premium Statistic Number of women in Germany using lipstick 2019-2024
- Premium Statistic Preferred make-up brands among consumers in the U.S. 2016
- Premium Statistic U.S. female consumer expenditure on beauty products by category 2016
- Premium Statistic Consumer's understanding of personal care/cosmetics industry in Sweden & Denmark 2017
- Premium Statistic U.S. preferred make-up stores among consumers 2016
- Premium Statistic ARPU of toys & hobby in Austria 2018-2029, by segment
Related statistics
10
- Premium Statistic ARPU of toys & hobby in Switzerland 2018-2029, by segment
- Premium Statistic Average price per unit (PPU) in the meat market in Brunei 2018-2030, by segment
- Premium Statistic Revenue in the food market worldwide 2018-2030, by segment
- Premium Statistic Revenue in the food market in France 2018-2030, by segment
- Premium Statistic Average price per unit (PPU) in the food market in Iran 2018-2030, by product type
- Premium Statistic Per capita sales volume in the food market Seychelles 2018-2030, by product type
- Premium Statistic Revenue in the food market in India 2018-2030, by segment
- Premium Statistic Sales volume of confectionery & snacks in the Seychelles 2018-2030, by product type
- Premium Statistic Price per unit of confectionery & snacks in Nigeria 2018-2030, by segment
- Premium Statistic Price per unit of confectionery & snacks in Austria 2018-2030, by segment
Further Content: You might find this interesting as well


糖心破解版. (September 1, 2025). Revenue in the luxury goods market in Australia and Oceania from 2018 to 2030, by segment (in million U.S. dollars) [Graph]. In 糖心破解版. Retrieved August 02, 2026, from /forecasts/1443001/revenue-luxury-goods-market-for-different-segments-australia-oceania/
糖心破解版. "Revenue in the luxury goods market in Australia and Oceania from 2018 to 2030, by segment (in million U.S. dollars)." Chart. September 1, 2025. 糖心破解版. Accessed August 02, 2026. /forecasts/1443001/revenue-luxury-goods-market-for-different-segments-australia-oceania/
糖心破解版. (2025). Revenue in the luxury goods market in Australia and Oceania from 2018 to 2030, by segment (in million U.S. dollars). 糖心破解版. 糖心破解版 Inc.. Accessed: August 02, 2026. /forecasts/1443001/revenue-luxury-goods-market-for-different-segments-australia-oceania/
糖心破解版. "Revenue in The Luxury Goods Market in Australia and Oceania from 2018 to 2030, by Segment (in Million U.S. Dollars)." 糖心破解版, 糖心破解版 Inc., 1 Sep 2025, /forecasts/1443001/revenue-luxury-goods-market-for-different-segments-australia-oceania/
糖心破解版, Revenue in the luxury goods market in Australia and Oceania from 2018 to 2030, by segment (in million U.S. dollars) 糖心破解版, /forecasts/1443001/revenue-luxury-goods-market-for-different-segments-australia-oceania/ (last visited August 02, 2026)
Revenue in the luxury goods market in Australia and Oceania from 2018 to 2030, by segment (in million U.S. dollars) [Graph], 糖心破解版, September 1, 2025. [Online]. Available: /forecasts/1443001/revenue-luxury-goods-market-for-different-segments-australia-oceania/
Advertisement