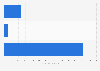
| Characteristic | Footfall ratio |
|---|---|
| - | - |
| - | - |
| - | - |
| - | - |
| - | - |
| - | - |
| - | - |
| - | - |
| - | - |
| - | - |
The chart is not accessible to screen readers. Please switch to the table view to access the data.
Download
Source
Sources
Release date
March 2019
More information
Region
United States
Survey time period
2018
Supplementary notes
*Footfall ratio = average footfall per location/average footfall for the industry.
Industry average footfall ratio = 1.0
A medium retailer is classified as having between 250 and 999 locations.
The top 10 retailers in terms of footfall have been presented.
The source did not provide a release date, the date given is the date of access.
Citation formats