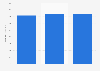
| Characteristic | Fuel gallons | Grocery and general merchandise | Prepared food and dispensed beverage |
|---|---|---|---|
| 2026 | 1.4% | 3.9% | 5.2% |
| 2025 | 0.1% | 2.3% | 3.5% |
| 2024 | 0.1% | 3.5% | 6.8% |
| 2023 | -0.8% | 6.3% | 7.1% |
| 2022 | 4.4% | 6.3% | 7.4% |
| 2021 | -8.1% | 6.6% | -2.1% |
| 2020 | -5.1% | 1.9% | -1.5% |
| 2019 | -1.7% | 3.6% | 1.9% |
| 2018 | 2.3% | 1.9% | 1.7% |
The chart is not accessible to screen readers. Please switch to the table view to access the data.
Loading statistic...
Download
Source
Source
Release date
June 2026
More information
Region
United States
Survey time period
2018 to 2026
Special properties
fiscal year 2026 ended April 30
Supplementary notes
The source adds the following notes:
* 'Same-store sales is defined as the total sales increase (or decrease) for stores open during the full time of the periods being presented. When comparing annual data, the store must be open for each entire fiscal year being compared. Remodeled stores that remained open or were closed for just a very brief period of time (less than a week) during the period being compared remain in the same store sales comparison. If a store is replaced, either at the same location (razed and rebuilt) or relocated to a new location, it is removed from the comparison until the new store has been open for each entire period being compared. Newly constructed and acquired stores do not enter the calculation until they are open for each entire period being compared as well.'
Citation formats