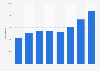
| Characteristic | Number of solicitors in thousands |
|---|---|
| - | - |
| - | - |
| - | - |
| - | - |
| - | - |
| - | - |
The chart is not accessible to screen readers. Please switch to the table view to access the data.
April 2023
Australia
2011 to 2022
In 2020, data collection has been standardised to include all solicitors holding a practising certificate in the relevant jurisdiction. In 2018, the total number of solicitors in Western Australia excluded solicitors who held a practising
certificate and were not actively practising, and those who held a practising certificate but were admitted outside Western Australia. For the purpose of analysing the growth rate of solicitors, the 2018 WA data has been adjusted to include these groups and will be different to the data in the 2018 report (Table 1 and Figure 2). For all other purposes, the 2018 WA data remains unchanged, including when analysing trends over time by gender, age, years since admission, practice sector or location.
Figures have been rounded.