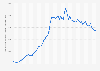
| Characteristic | Hours lost per year |
|---|---|
| - | - |
| - | - |
| - | - |
| - | - |
| - | - |
| - | - |
| - | - |
| - | - |
| - | - |
| - | - |
The chart is not accessible to screen readers. Please switch to the table view to access the data.
Download
Source
Source
Release date
March 2021
More information
Region
United Kingdom
Survey time period
2020
Supplementary notes
The source calculated the additional time spent due to traffic for commuters between multiple points within e.g. the United Kingdom; the source takes into account peak speed and free-flow speed data for the busiest sub-areas and commuting corridors.
Citation formats