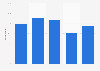
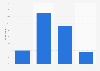
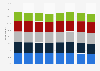
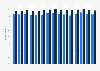
| Characteristic | Share of respondents |
|---|---|
| - | - |
| - | - |
| - | - |
| - | - |
The chart is not accessible to screen readers. Please switch to the table view to access the data.
Download
Source
Source
Release date
September 2018
More information
Region
Singapore
Survey time period
January to March, 2018
Number of respondents
2,023 respondents
Age group
15 years and older
Special properties
this survey is conducted every two years; the period surveyed was for the year 2017
Method of interview
Face-to-face interview
Supplementary notes
*Digital consumption is defined by the survey conductors as such: "Accessing arts and culture content via electronic and digital media (e.g. TV, DVD, radio, Internet and portable media devices)."
Data prior to 2015 found in previous reports.
For 2015, N= 2,041
For 2013, N= 2,015
For 2011, N= 2,038
Citation formats