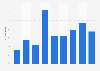
| Characteristic | Annual revenue per employee in thousand U.S. dollars |
|---|---|
| - | - |
| - | - |
| - | - |
| - | - |
| - | - |
| - | - |
| - | - |
| - | - |
| - | - |
The chart is not accessible to screen readers. Please switch to the table view to access the data.
Download
Source
Sources
Release date
February 2024
More information
Region
Worldwide
Survey time period
2015 to 2023
Number of respondents
59 respondents
Special properties
Billable architecture and engineering services organizations
Supplementary notes
Survey method not provided by the source.
Data prior to 2019 was taken from previous editions.
2015 baseline: 49
2016 baseline: 53
2017 baseline: 153
2018 baseline: 100
2019 baseline: 44
Citation formats