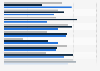
| Characteristic | Technology or IT consulting | Business / management consulting | Managed services | Subscription services | Staff augmentation | Hardware, software or equipment | Other |
|---|---|---|---|---|---|---|---|
| 2024 | 27.4% | 34.2% | 10.9% | 7% | 5.8% | 3% | 10.9% |
| 2023 | 31.2% | 30.5% | 12.2% | 7% | 5.3% | 3% | 10.9% |
| 2022 | 31.7% | 30.6% | 10.6% | 7.6% | 6.4% | 3.1% | 10% |
| 2021 | 34.4% | 34% | 9% | 6% | 5.6% | 2.4% | 8.6% |
| 2020 | 34.6% | 27.8% | 9.2% | 9.6% | 6.3% | 3.5% | 9% |
| 2019 | 39.4% | 23.8% | 9% | 8.3% | 5.5% | 4.5% | 9.6% |
| 2018 | 34.7% | 24.7% | 9.5% | 7.6% | 5.2% | 4.3% | 14% |
| 2017 | 31.9% | 27.4% | 10.4% | 2.7% | 4.3% | 3.2% | 20.1% |
| 2016 | 41.1% | 23.8% | 10.4% | - | 6.3% | 7.5% | 10.7% |
The chart is not accessible to screen readers. Please switch to the table view to access the data.
Loading statistic...
Download
Source
Sources
Release date
May 2025
More information
Region
Worldwide
Survey time period
2016 to 2024
Number of respondents
403 respondents
Special properties
Billable professional services organizations
Supplementary notes
The source defines the professional service industry as accounting, advertising and marketing, architectural, management consulting, engineering, IT, legal, and research services.
Survey method and number of respondents for the surveys prior to 2020 not provided by the source.
Figures prior to 2022 were taken from previous reports.
Citation formats