| Characteristic | 2017 | 2018 | 2019 | 2020 |
|---|---|---|---|---|
| - | - | - | - | - |
| - | - | - | - | - |
| - | - | - | - | - |
| - | - | - | - | - |
| - | - | - | - | - |
| - | - | - | - | - |
| - | - | - | - | - |
| - | - | - | - | - |
| - | - | - | - | - |
| - | - | - | - | - |
| - | - | - | - | - |
| - | - | - | - | - |
| - | - | - | - | - |
| - | - | - | - | - |
| - | - | - | - | - |
Download
Source
Source
Release date
June 2021
More information
Region
Russia
Survey time period
2017 to 2020
Supplementary notes
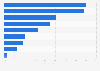
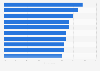
* Household penetration rate refers to the share of households buying a brand.
Citation formats